“Nations rise on the strength of their trade. Those that export thrive;
those that do not fall behind.”
Trade – Exports and Imports Part 1
Trade — in both goods and services — is one of the most important drivers of a country’s Economic Prosperity. When a nation consistently Exports more than it Imports, it strengthens its currency, expands its industries, creates higher quality jobs, and raises the Standard of Living for its citizens.
Canada participates in the global economy through two major channels:
- Merchandise Trade, which captures the physical goods crossing our borders.
- Services Trade, which includes consulting, engineering, IT, finance, education, and other forms of expertise that Canada sells to the world.
Understanding how these two systems work — and how they differ — is essential to understanding Canada’s current economic position.
Canada’s Most Recent Trade Snapshot
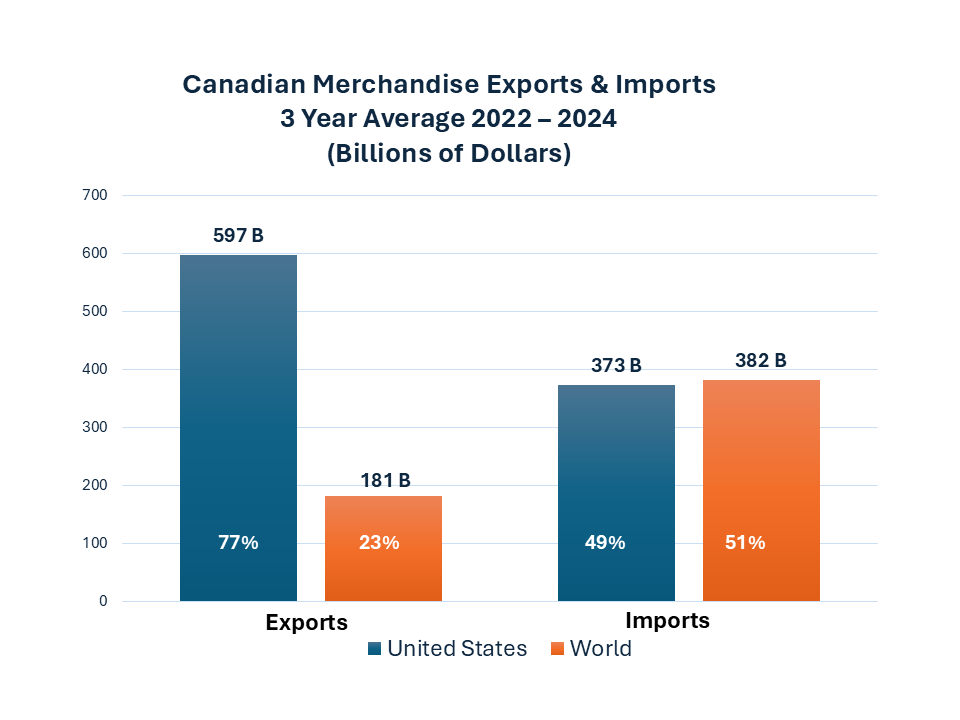
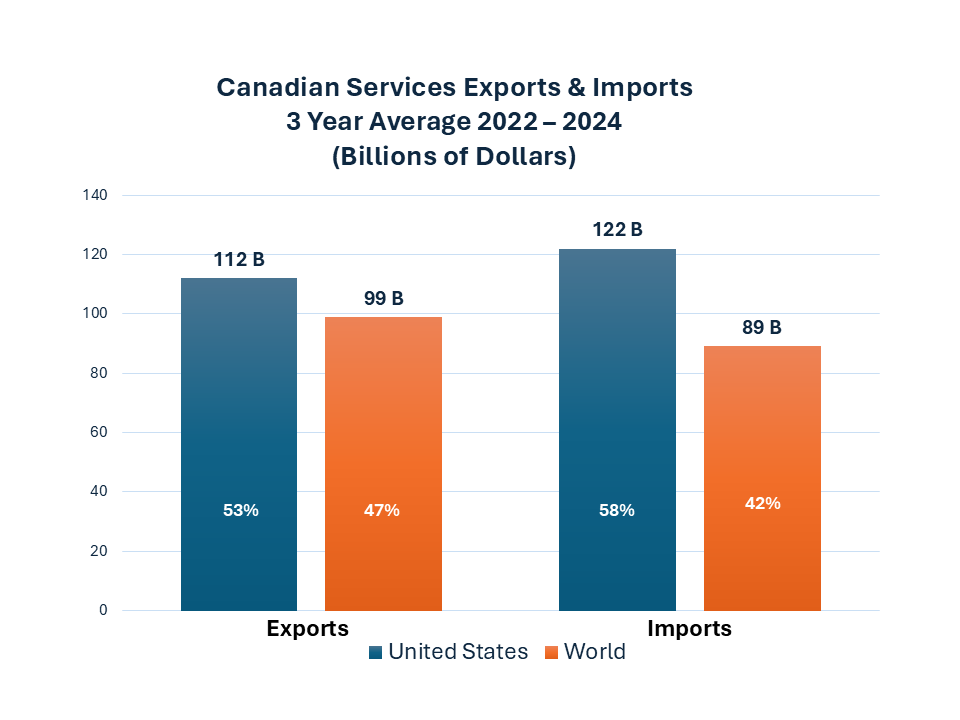
Below are two visuals that provide a snapshot of Canadian Exports and Imports for both Merchandise and Services. The numbers are a three-year average of trade data from 2022 to 2024 sourced from Statistics Canada.
Where Canada Exports To and Imports From
The first visual shows a 3-year average of annual Canadian Merchandise Trade exports to and Imports from the world. You will note that Canada exported ~77% of its merchandise to the United States and in return imported ~49% of their merchandise.
The second visual shows a 3-year average of annual Canadian Services Trade exports to and imports from the world. You will note here as well that Canada exported ~53% of its services to the United States and in return imported 58% of their services.
Note: I discuss Canada´s export and import numbers in greater detail in a separate post called Trade Exports – Imports Part 2 of 2. You will find the details both interesting and surprising.
Why These Numbers Matter
These numbers and percentages are not just statistical details — they reveal significant structural realities about Canada’s economy.
Through decades of Canada operating without an Industrial Strategy that would have diversified the country´s economic risks, we find ourselves at a greater economic risk today than we have at any other time over the past 75 years.
Given that the United States has opted to abandon international trade rules that have governed world trade for the better part of 75+ years – trade rules they took the lead in getting the world to adopt in the first place – Canada´s economy will experience significant economic turbulence for at the least the next 20 years until it can reduce its dependency on the United States for the bulk of its trade.
What Canada Needs To Do
Canada’s trade performance is not predetermined — it is shaped by the choices we make.
Canada’s long‑term Economic Prosperity depends on our ability to sell more to the world, beyond the United States, than we buy.
Sustaining and expanding Canada’s prosperity requires deliberate action. Specifically, Canada must accelerate its capacity to produce, innovate, and compete globally.
That means developing and executing integrated Industrial, Trade, Economic, Education and Talent Recruitment Strategies that enable Canadian firms to diversify beyond the United States, by growing high‑value Exports in both goods and services.
In subseqent posts I will speak in about these Strategies in more detail — the policies, investments, and enablers that can help Canada accelerate its export capacity, reduce structural vulnerabilities, and build a more resilient, prosperous economy for the decades ahead.
In my next post called Trade Exports and Imports Part 2 of 2 I would like to discuss Canada´s trade numbers in greater detail. In discussing those numbers I will also be speaking about the so called 15 Free Trade Agreements Canada has signed over the past 20+ years. You will likely be shocked by what you read.
If you have not done so already, please review my Legal Stuff page.